Last week we rolled out a major update of our General and Personal statistics pages. The update is a refreshing new look at all the most important measurements investors need to make informed decisions. Customers have embraced the new layout and charts which provide wide range current data to quickly understand the value of holdings.
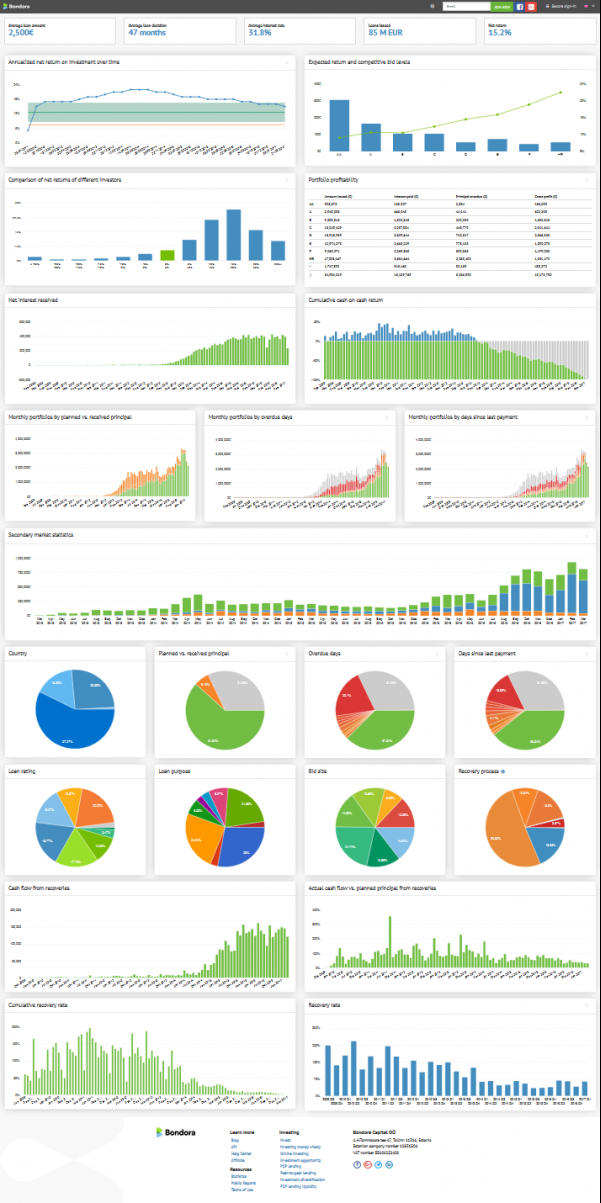
At Bondora we’ve taken the time to arrange the data with graphical representations that make getting the critical info fast. We’ve created large layouts and a tile design that prioritizes data on annualized net returns, bid levels and profitability by loan rating and many more. We have also included new risk management charts including cash flow from recoveries, and cumulative recovery rates.
We have always made transparency the core of our mission. This characteristic sets us apart from the competition. However, transparency means more than just making information available. We want transparency that makes the data useful, meaningful and clear. The new designs and data options achieve this end.
Our new data outlay offers the benefits of broad analytics and granular information in one package. That is, without having to leave the page investors can see general trends or information specific to a particular period. This duality is possible with the hover feature which brings detail to the foreground when selecting segments of a graph.What’s more, many of the charts and graphs are customizable in terms of how you want to see the data.
In the coming weeks, we’ll offer more insights to the data and how best to use it for wise investing choices.
[…] Get better insight with our new Statistics pages […]