Welcome to another post from our monthly funding statistics series. Here, we talk about the most popular investment methods used by our customers in December and how this has changed since the previous month. This month, we’ve also got some statistics to share on the total figures for 2017.
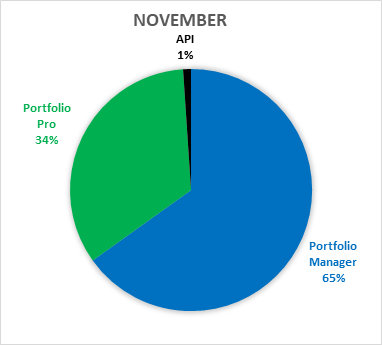
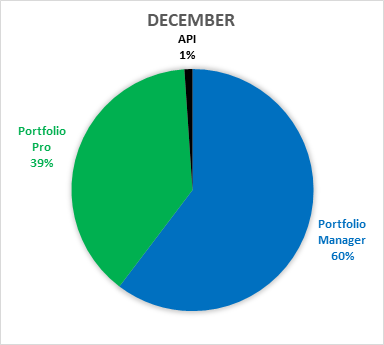
After seeing the share decrease for the first time in November, December has seen the share of investments made using Portfolio Pro increase to its highest figure to date at 38.6%. In line with this, the share of investments through Portfolio Manager decreased by approximately 5%. The API share also increased in December by 0.02%. Let’s take a look at how these figures compare to the 2017 totals.
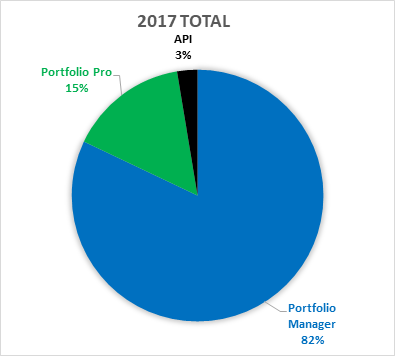
The overall funding statistics for 2017 show a significant difference to the most recent months. Why? Well, Portfolio Pro was only launched in July 2017 so the data may not be as representative of the recent trends. However, it is reasonable to suggest based on all the statistics that the highest percentage of investors can be classified as passive (Portfolio Manager) and like to set up their investments with no further management or time required. The next most common type of investor is semi-active (Portfolio Pro), it’s likely they have a specific strategy and target planned so they filter their investments by country, rating, interest rate and more. The final and least common type of investor can be considered as the professional (API) – they either have a technical background or have invested significant time to learn how to build their own API.
Which type of investor are you? Leave us a comment below and let us know.