Last month, we released a post that dug in to the origination of loans by unique data like home ownership, education, employment duration and more. This month, we’re going to do the same and compare how this has changed since October. We’ve added one extra data point for review this month which is verification, meaning how many customers income and expenses we verify before issuing a loan.
Average income, loan amount and age
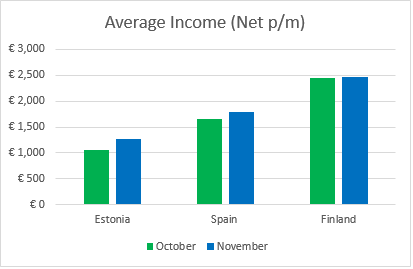
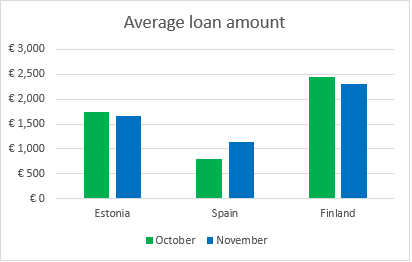
The average net monthly income of borrowers has increased across the board in November. Despite the reduction in the average loan amount in Estonia and Finland, this figure has increased by 44% in Spain. If you haven’t seen our recent post covering the origination of loans by credit rating, take a look here and see how this correlates with changes in originations across different risk ratings, specifically the change in HR between October and November.
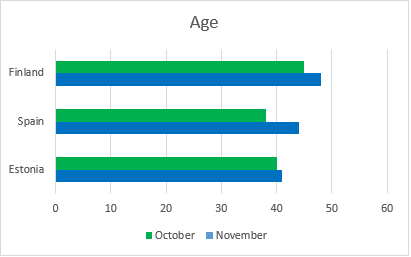
Across all countries of origination, the average age of borrowers have also increased. Perhaps this is correlated to the increase in average net income?
Loan and employment duration
November has shown the same pattern as October for loan duration, with 36 months being the most common, followed by 60 months. Employment duration also followed suit with ‘More than 5 years’ being the most common, followed by ‘Up to 5 years’ and ‘Up to 1 year’. This would suggest that most people decide after 1 year if they are going to stay with their existing employer and once they have been there for 5 years, they aren’t going anywhere else.
| Loan durations | Estonia | Spain | Finland |
| 3 | 0 | 0 | 0 |
|---|---|---|---|
| 6 | 4 | 0 | 1 |
| 9 | 7 | 4 | 0 |
| 12 | 12 | 4 | 1 |
| 18 | 10 | 14 | 2 |
| 24 | 36 | 2 | 0 |
| 30 | 17 | 2 | 0 |
| 36 | 658 | 173 | 186 |
| 48 | 68 | 26 | 37 |
| 60 | 489 | 32 | 91 |
| Employment duration | All countries |
| Trial Period | 14 |
| Up to 1 Year | 341 |
| Up to 2 Years | 52 |
| Up to 3 Years | 71 |
| Up to 4 Years | 27 |
| Up to 5 Years | 500 |
| More than 5 Years | 775 |
| Retiree | 55 |
| Other | 41 |
Education and home ownership
Spain had the highest share of originations with a university level education at 51%, whereas Estonia had the lowest at 24%. The most common level of education in Finland was ‘Vocational’ and in Estonia it was ‘High School’.
| Education level | Estonia | Spain | Finland |
| Junior high school | 174 | 24 | 43 |
|---|---|---|---|
| Vocational | 158 | 26 | 117 |
| High school | 653 | 76 | 76 |
| University | 316 | 131 | 82 |
In Finland and Estonia, owning a home outright is the most common type of status above renting, living with parents and having a mortgage. In contrast, the most common type of living status in Spain is ‘Living with parents’ where as in Finland this figure is only 1.26% of the total country share. These differences can be attributed to many factors, such as age or even cultural norms.
| Home ownership status | Estonia | Spain | Finland |
| Owner | 600 | 56 | 120 |
|---|---|---|---|
| Owner Mortgage | 136 | 40 | 81 |
| Living with parents | 230 | 87 | 4 |
| Tenant | 274 | 61 | 102 |
| Council house | 15 | 2 | 6 |
| Other | 46 | 11 | 5 |
Verification
The data below shows how many customer’s income and expenses have been verified. Regardless of whether the borrower’s income has been verified, the background checks on population and credit referencing agencies are still conducted.
| Income | Estonia | Spain | Finland |
| Verified | 650 | 238 | 275 |
|---|---|---|---|
| Unverified | 651 | 19 | 43 |
Which data point is the most important?
The individual risk of issuing a loan to a borrower is calculated using all of the parameters above and many more. The self-reported data which is displayed to investors is typically not very predictive and has relatively little influence on the Bondora rating of a particular loan. Therefore, this information should not be viewed as the only data used in determining the expected default of a loan.
Overall, this can give you a great idea of the basic profile of our borrowers and how this changes with the origination of loans in the coming months. Leave us a comment below and let us know which data points you think are most influential in credit scoring.